
Velciraptor 102

This post is the second in my series about Velociraptor. If you came across this post and want to read the last one, you can read it here. Otherwise, stick around and continue your journey with Velociraptor!
Velociraptor has become a cornerstone in modern DFIR (Digital Forensics and Incident Response) workflows. Its ability to perform live response, artifact-based collection, and scalable investigations makes it indispensable for forensic analysts. Unlike traditional tools that rely on static imaging, Velociraptor leverages VQL (Velociraptor Query Language) to dynamically query endpoints and retrieve targeted data quickly.
In this post, we’ll explore Velociraptor’s major features, common Windows artifacts it supports, and practical VQL examples to extract actionable intelligence. Let’s get into this.
Major Features of Velociraptor
Velociraptor has many notable features, not the least of which is any of the ones that I have previously mentioned. In the last post, I talked about the fact that it operates on a server-client framework. This is one of its most powerful features. It is so powerful because it allows Velociraptor to gather predefined sets of data from a large amount of computers across a network, effectively eliminating the need for individual extractions of these computers. This serves to save us time and save our clients money if deployed correctly.
Another major feature of Velociraptor is the ability to query the system for certain types of data without taking a full system image. Velociraptor allows you to deploy a query language called VQL in order to query systems for data. VQL is specific to Velociraptor and easy for examiners to learn and deploy to begin gathering data from computers. This ease comes from its similarity to SQL. One such query is:
SELECT Name, Size, Mtime FROM glob(globs=”C:\Users\*\AppData\Roaming\Microsoft\Windows\Recent\*.lnk”)
Which allows the user to query all of the clients for shortcut files that are found in user profiles. This is useful for finding evidence of files that were recently accessed by the user of the system in question.
On top of the ability to find the specific artifacts that you want, Velociraptor has its own predefined artifacts already built into the software.
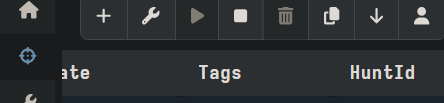
With “Hunts” tab selected, click the “+” to open the “New Hunt” menu.
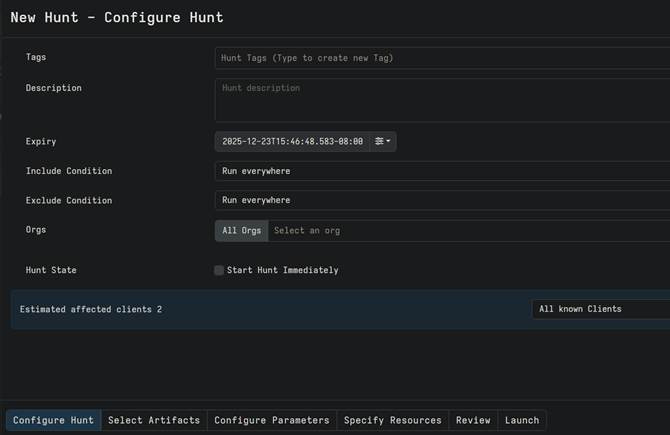
The “Hunts” tab is where you can find the “Select Artifacts” menu, which showcases all of the built-in artifacts that velociraptor supports. You can find this by navigating to the “Hunts” tab and clicking the “+” button (Start New Hunt) and going through the subsequent menus. The first menu allows you to configure the main properties of the hunt. The picture below shows what this looks like. Once the configuration is done to your liking, you can move onto selecting your artifacts by clicking “Select Artifacts.
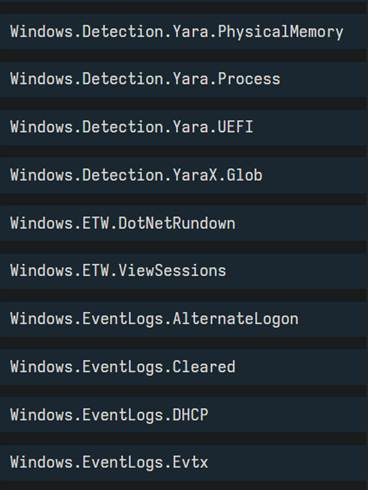
Each Artifact shows the VQL quries when they are selected from the menu. They are named in the following format:
SYSTEM.TYPE.ARTIFACT
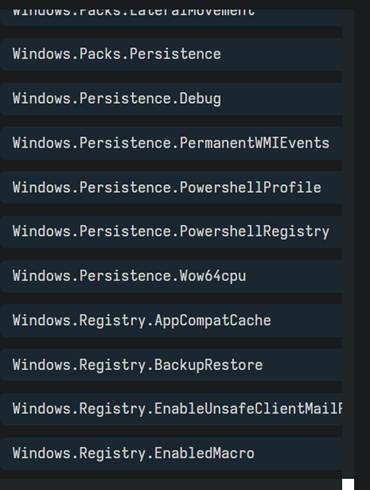
This makes it easy to search for things such as MFT, PowerShell logs, Audit Policy and a whole host of other things. I’ll show a couple of examples of lists of Windows artifacts so you can see an example of what Velociraptor can find.
There are also several for Mac and Linux. I’ll share one screenshot of each for completeness.
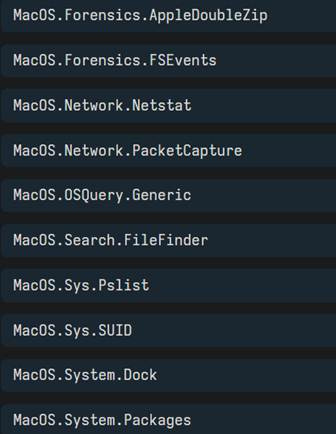
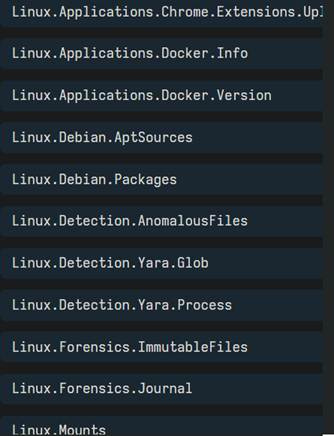
When we look further at the list, we see that it is a nearly complete list in the current version at the time of writing, which is 0.7.5.
The next step after selecting the artifacts from the list is to set the parameters. It is totally fine to not set any, but that’ll mean that you will probably get data that is out of range (if that is really important to you) so setting the ranges is at least partially necessary. You can do this with parameters set by each of the artifacts that you select. The example I give here is the system event log (evtx) artifact. It has a few parameters that are shown in the image below.
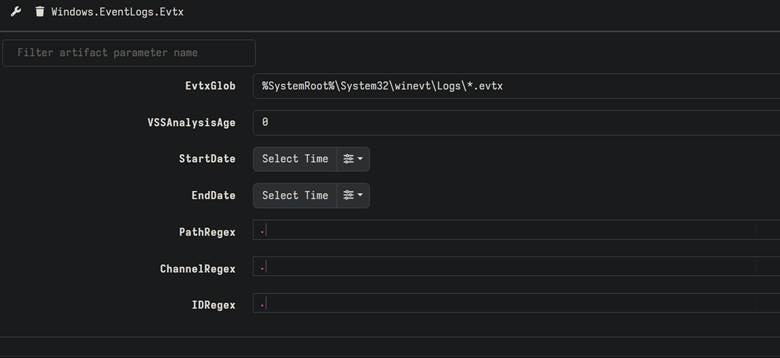
You can find these by pressing the wrench icon near the artifact. Tweak the parameters as needed for each artifact to get the most data that you can.
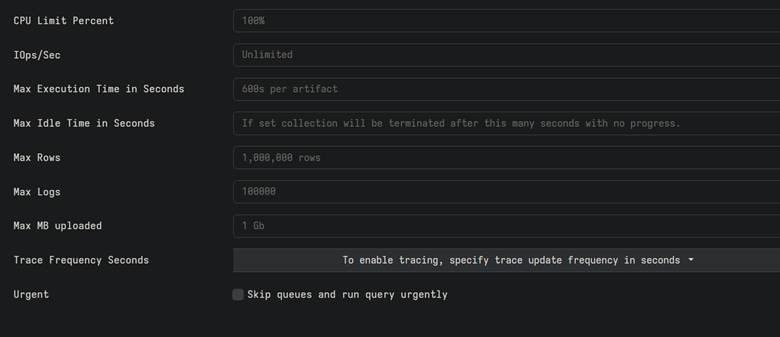
After specifying the parameters of each artifact you want, you can move onto the “Specify Resources” tab. This tab is special because you are able to control the flow of files across the network used by each system in the picture. This is especially helpful for networks with large amounts of systems because you will be able to ensure that the files gathered are not big enough to slow down the network in any huge way or to slow anyone using the computers down while the hunt operation is going on. The image below shows the options you can tweak.
Scalability and Live Response
As mentioned, Velociraptor is incredibly scalable. After all, its main use case is to be run across large networks to gather information from a large amount of systems at a time. This makes it useful for investigating incidents at large companies, giant corporations, and even across multiple networks!
On top of that, since Velociraptor features hunts, which are live searches for artifacts on systems, investigators are able to do live triage. Live triage allows us to get the artifacts while they’re hot and is indispensable for gathering live evidence that disappears after a short amount of time, like RAM artifacts, network connections and certain elements of prefetch.
When it comes to Live response, as I said, Velociraptor is able to do the coolest thing: grab the data without disrupting operation. This is extremely helpful when you consider that deploying tools that disturb functions of the computer are not only bad for the people that should be on them, but also for the activity of attackers. Attackers could further disrupt computer activities if they find that they are being watched or their activities are being obviously mitigated. It is always wise to use tools that are covert when in the process of incident response and Velociraptor fits this bill.
Key Windows Artifacts and How to Use Them
Velociraptor has many built-in Windows artifacts to choose from. For this section, I have selected some of the most useful ones that are included.
$MFT (Master File Table)
The $MFT records every file on an NTFS volume, including timestamps and metadata. You can find this artifact by searching the artifacts list for Windows.NTFS.MFT. After finding and selecting this one, you can filter by folders like Temp or AppData to spot suspicious areas for malware staging.
This artifact is important because it allows us to see evidence of file creation and it is one piece of evidence that we can add to our list aggregated for timeline creation. The following code block shows an example of how the $MFT artifact is composed in VQL.
SELECT FileName, SI.Mtime AS Modified, SI.Ctime AS Changed
FROM Artifact.Windows.NTFS.MFT()
WHERE FileName LIKE ‘%temp%’
ORDER BY Modified DESC
Registry Hives (SAM, SYSTEM, SOFTWARE)
If we want to delve deeper into the settings, installed programs and other user-related aspects of the system, we can check the registry by using the Windows.Registry.Hive artifact in Velociraptor. This can allows us to look into important things like the accounts added to the computer, the run keys for programs that can be used as persistence mechanisms, and even settings and other information about the software that has been installed on the system.
The following code block shows a query that is useful in velociraptor to compose a Registry query.
SELECT Key, Value
FROM Artifact.Windows.Registry.Hive(hive=”SOFTWARE”)
WHERE Key LIKE ‘%Run%’
This is a reader-supported newsletter. If you like this post and want to see it continue, please subscribe and consider pledging financial support by becoming a paid subscriber.
Event Logs
Windows Event Logs provide insight into authentication, system changes, and application behavior. The Velociraptor query used to find them is Windows.EventLogs.
Event logs can be of great use to us and, as such, are one of the most important artifacts that we can use in an investigation. This is because they can detect things like log ins or log outs, spot service installations, spot credential changes, spot major system changes, and spot unusual device behavior from remote locations or applications.
The following is a VQL query that can help us to find user logins/logouts, network events, and firewall tampering.
SELECT EventID, TimeCreated, Message
FROM Artifact.Windows.EventLogs(log=”Security”)
WHERE EventID IN (4624, 4625, 4954, 5025, 5153)
ORDER BY TimeCreated DESC
Prefetch Files
The Windows Prefetch is an artifact that helps show us the programs that have been run. A prefetch file is created when a program is started. It stores heavily used assets and schemes used by the program to render the execution quicker.
The interesting thing about this artifact in Velociraptor is that it only has two parts to its name. They are: Windows.Prefetch.
Given Prefetch’s qualities of being used at the beginning of running programs, we can look for suspicious programs in the prefetch cache and determine if they have any evidence of being started. This evidence of starting can help us to build a timeline that will show all of the times when the possible malware was run. High amounts of unknown software being run is a strong indicator of malware being run on the computer.
The following VQL query can help us to find prefetch artifacts in a Windows system:
SELECT Executable, RunCount, LastRunTime
FROM Artifact.Windows.Prefetch()
ORDER BY LastRunTime DESC
Tip: High run counts for unknown executables can indicate persistence.
Helpful Tips for Velociraptor
Begin with the most important information on the Windows system for quick triage (Event Logs, Prefetch, registry, etc.)
Apply filters (i.e. WHERE clauses) to denote crucial data to focus on.
Combine data recovered from various artifacts to build a comprehensive timeline.
Use the hunt manager to automate the hunts for data across multiple endpoints and seamlessly capture the data.
Conclusion
In today’s post, I gave more information on Velociraptor. You learned about its main strengths, how to use its artifacts manager and how to create VQL queries to you’re your own artifacts. This is all helpful information and it can be the start of you using Velociraptor to its full effect. I know that this will be a big push in the right direction!
You learned about how Velociraptor’s flexibility and speed make it a game-changer for forensic investigations. By leveraging its artifact library and VQL, you can quickly uncover attacker activity without the overhead of full disk imaging. Whether you’re hunting for persistence, analyzing execution history, or building timelines, Velociraptor provides the tools you need.
If you enjoyed this post, make sure you trll me what you enjoyed most about and share it with a friend. Subscribe if you want more. As always, this has been Matt, talking about Velociraptor. Until next time, Matt, OUT!

Hi Matt, does Velociraptor play well with Defender, or would I need to make a bunch of exceptions?